about control strips and charts
alwan toolbox control
strips and charts
Alwan ToolBox offers you the ability to measure standard as well as proprietary control strips and charts.
Control strips are usually used for conformance assessment – FOGRA and IDEAlliance control strips – however some of them can be used for device calibration.
Charts are usually used for device profiling – ECI, IT8 and Hydra® charts – however some of them can be used for device calibration or evaluation such as IDEAlliance P2P and TC 1617.
process control
which control strip to use for print and proof assessment?
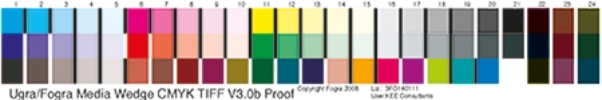
FOGRA Media Wedge CMYK v3.0 (three lines)
This control strip can be used to assess print (ISO 12647-2) as well as proof (ISO 12647-7) conformance. (FOGRA Media Wedge can be purchased from fogra.org)
IDEAlliance ISO 12647-7 Control Wedge 2013
This control strip can be used to assess print (G7® Grayscale or G7® Targeted) as well as proof (ISO 12647-7) conformance. (IDEAlliance Control Wedge can be downloaded from idealliance.org)

Alwan Color Expertise control strips:
Several Alwan Color Expertise control strips are available for ISO 12647-2 and G7® calibration and conformance assessment. (Alwan control strips package can be downloaded here)

print and proof conformance assessment steps
AlwanToolBox allows you to virtually use any control strip (or chart) to assess the conformity of a print or a proof. el_rey_de_la_rosa willow harper onlyfans Fermin Reyes
To be able to measure a control strip you need to:
-
Print control strip image file :
You need to get and print the image file – .tiff or .pdf – of the control strip in order to measure it.
-
Measure control strip print-out:
Alwan ToolBox contains the definition file of the displayed control strip names, this means that you can measure these printed control strips as soon as you print them.
Should you need to measure a control strip which is not included in the Alwan ToolBox list, you can do that by using the "Import Definition File" button. These files are usually delivered with the control strip.
profiling
which chart to use for profiling?
Alwan ToolBox includes the definition file of the latest ECI and IT8 profiling charts as well as a full set of Hydra Profiling® charts. All these charts are publicly available, therefore, you can find their image files on the corresponding platforms, print them, and measure them with Alwan ToolBox. Should you need to measure a chart which is not included in Alwan ToolBox, you can do that by using the "Import Definition File" button. Definition file is usually delivered with the corresponding chart.
FOGRA Media Wedge CMYK v3.0 (three lines)
Alwan’s patented Hydra® spectral prediction technology has been developed to help you accurately profile your print device faster and cheaper than ever by using charts with a very small number of patches – up to 40 times less – compared to conventional charts. A set of Hydra® charts for various printing processes – conventional and digital – and various instruments – patch and scan measurement – are available in the Alwan ToolBox configuration windows. You can easily choose the right Hydra® chart by picking the one whose name corresponds to your printing process and spectrophotometer.

For more details about the latest Hydra® charts, please refer to the "Read Me" file included with Hydra® package. Download the latest Hydra® package (v.1.4.2) here.
Hydra Profiling® charts for special processes
If you are printing on a process and/or using a color palette which are not included in the Hydra® standard charts package, please ask your Alwan dealer or sales@alwancolor.com for help.